State of the Union
Welcome to the first in a strictly limited series. Every Monday [1] for the next 9 weeks, I’ll be doing a rundown of the forecasts from the main poll aggregators and analysts [2] for the 2024 US elections. Hopefully this will be useful as a baseline and a reference point for everyone.
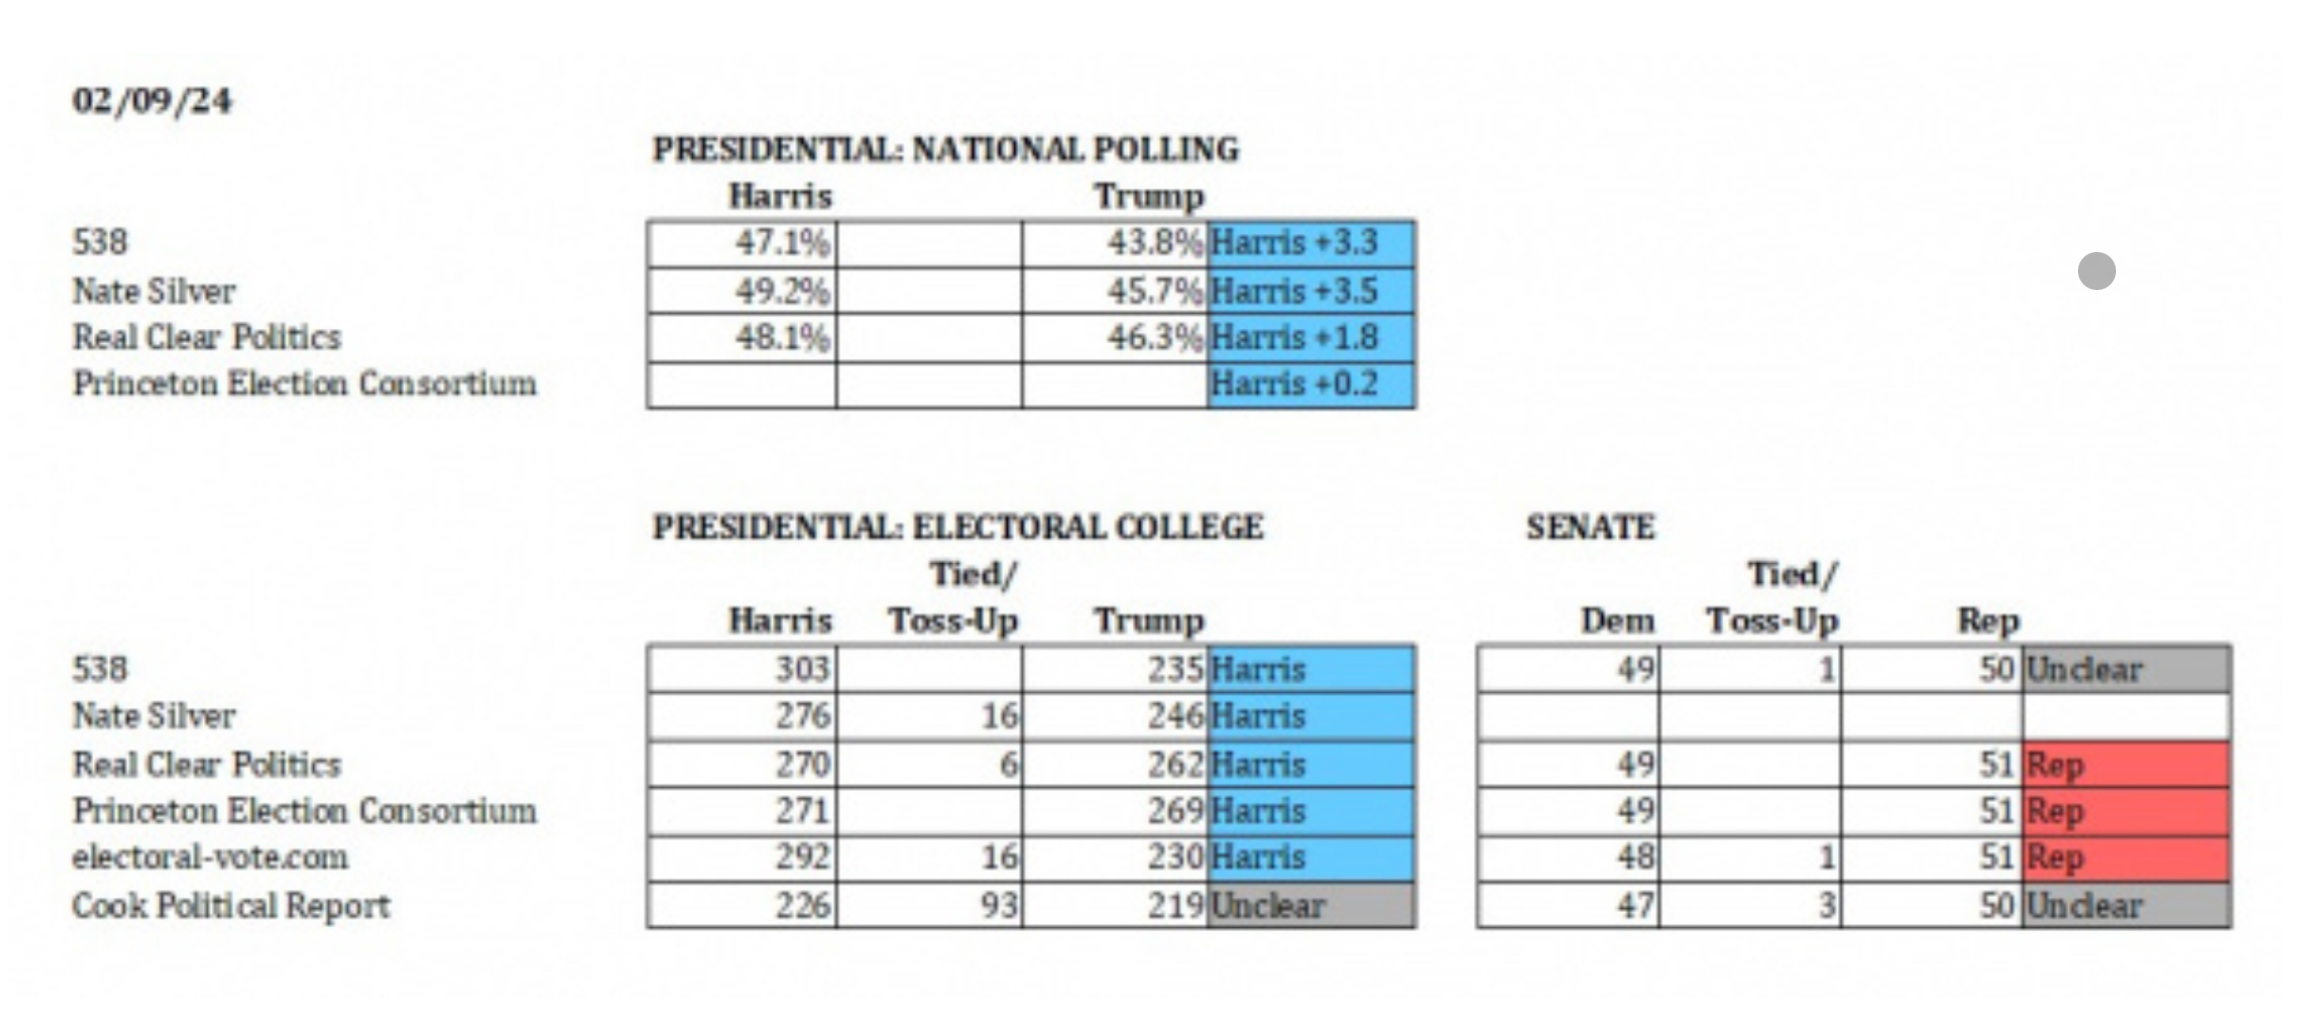
Of the forecasts included:
a) electoral-vote.com and Real Clear Politics are basically poll averages; RCP is included because it’s well known and often quoted, although there are very well documented issues with how they use and present poll figures [3];
b) 538 and Nate Silver use a rather more complicated modelling process which takes polling figures and applies modifiers between national and state polling, and also accounts for influences such as convention bounces.;
c) Princeton Election Consortium (run by Sam Wang, neuroscience professor and data/statistics maven) presents a slightly different modelling approach, giving a ‘meta-margin’ based on state polling alone. It’s worth reading his write-up on the methods on the website, and all of his data and scripts are downloadable for anyone interested.
d) The Cook Political Report is no longer run by Charlie Cook, but under Amy Walter it remains a well-respected source of critical analysis of US political data. Their figures use polling, but then apply exhaustve subjective analysis.
This won’t be covering the House, as seat polling is a) not terribly reliable and b) very patchy in coverage, but there will be Presidential and Senate figures for all the forecasts – except Nate Silver, who isn’t modelling the Senate this cycle.
James Doyle
[1] All data correct as of 12:00 2nd September.
[2] If anyone feels I’ve missed out someone significant from the list as shown, let me know
[3] Note also I’ll be using the RCP state polling averages for both Presidential and Senate elections, not their maps – the maps don’t reflect their polling figures