A tale of two seats: Maidstone and Macclesfield

Like many on here, I have spent some time sifting the constituency markets looking for value bets. Boundary changes mean that Ordnance Survey’s excellent Election Maps site is required in addition to Wikipedia. I’ve generally stayed away from the Conservative-Labour battlegrounds and focussed on seats where it’s not clear who will be the main challenger to the Conservatives or the SNP. However, I have found two seats that provide interesting case studies for how our politics have realigned in the last decade.
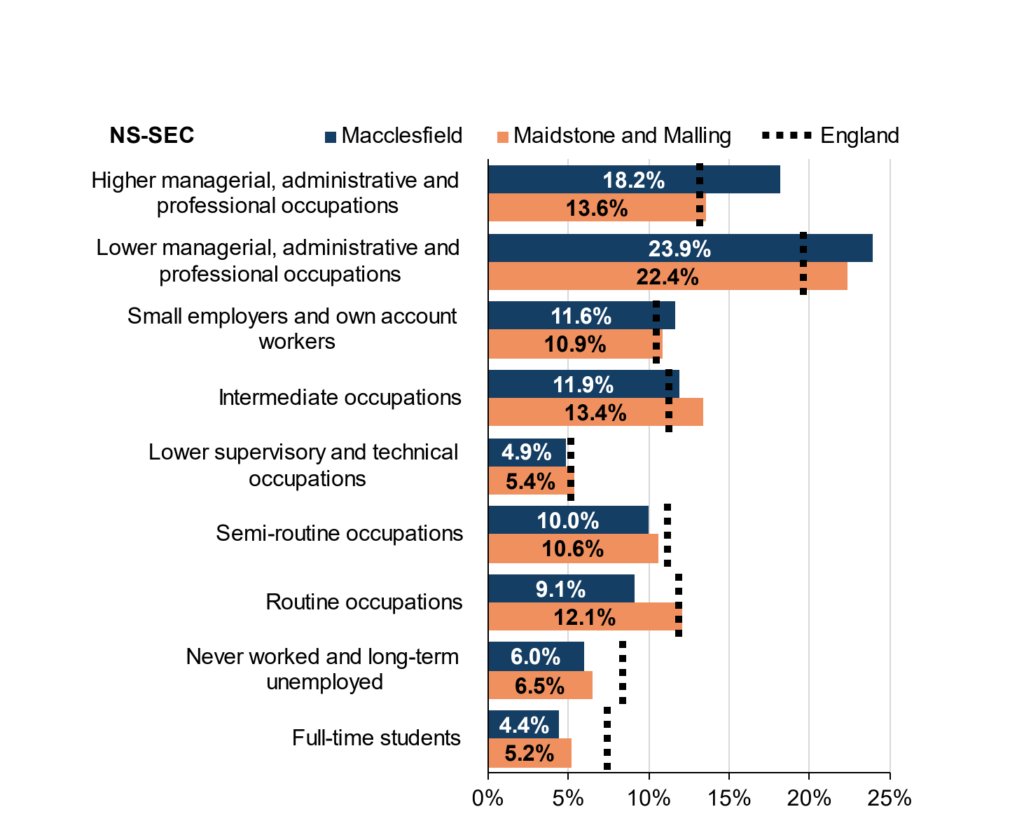
First things first. I’ve never been to Maidstone (or Malling) and I’ve never been to Macclesfield. All I know about Maidstone is that it has a Crown Court and all I know about Macclesfield is that they have Robbie Savage. My instincts are that Macclesfield is quite middle class and the chart below confirms that. Over 18% of its adult population are employed or were previously employed in higher managerial, administrative and professional occupations (13.2% in England as a whole). Whilst Maidstone and Malling is slightly more middle class than average, these two seats demonstrate the east-west divide that receives a lot less attention than the north-south divide

Source: Aggregated ward level 2021 Census data via NOMIS
In Kent, the boundary commission have combined Maidstone and Malling into a single seat. Historically, they have been in separate constituencies producing large Conservative majorities. The new seat combines urban areas from three existing Conservative seats:
· Maidstone and The Weald (majority of 21,772 (42.1 percentage points (pp)) over Labour)
· Tonbridge and Malling (majority of 26,941 (47.3pp) over the Lib Dems)
· Chatham and Aylesford (majority of 18,540 (42.8pp) over Labour)
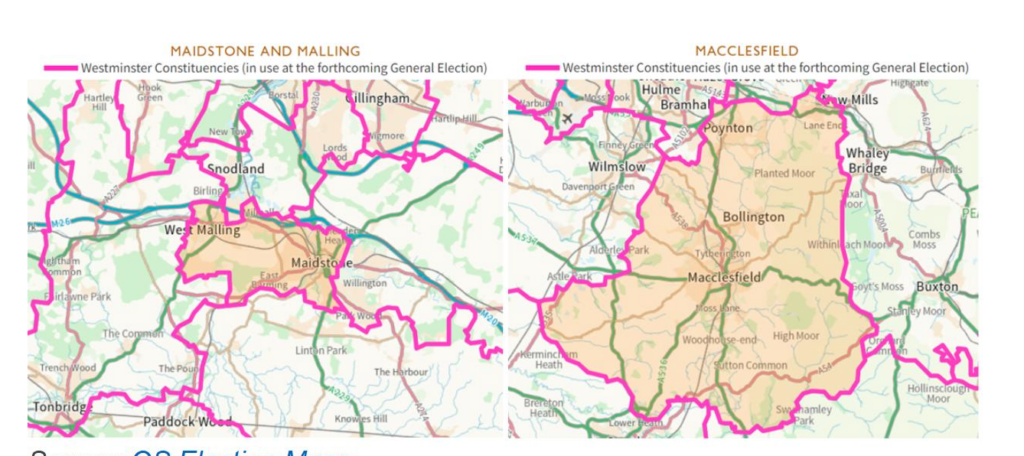
Whilst these figures look healthy for the Tories, the map below shows that the new seat is geographically quite small. For comparison, the scale has been set to that used for the adjacent Macclesfield map.

Source: OS Election Maps
Electoral Calculus reckon a notional 2019 result for Maidstone and Malling would have the Conservatives on 59% of the vote with both Labour and the Lib Dems around 40pp behind. Nevertheless, they give Labour a 68% chance of winning the seat.
In Macclesfield, where there are no boundary changes, the Conservatives are defending a majority of 10,711 (19.9pp) over Labour. Electoral Calculus give Labour an 84% chance of taking the seat.
Bet365 make Labour 1/7 favourites in Macclesfield. I find it remarkable that a seat like Macclesfield could go Labour. In 1997, the Tories held it with a majority of 8,654 (16.0pp). However, if the polls stay as they are, it’s going Labour.
In Maidstone and Malling, Bet365 make it a toss up between Labour and the Conservatives (both 10/11) with the Lib Dems and Reform (both 25-1) as outsiders. The local election results have been mixed with the Lib Dems doing quite well in both Maidstone and Tonbridge and Malling. However, Labour and the Greens have won seats in the area too and I suspect the Lib Dems in the area will be focussing on Tunbridge Wells. It is a new seat and that might save the Tories if the opposition vote is split. But I think the anti-Tory vote goes Labour. Therefore, I’ve had a small bet on Labour at 10/11.
TLG86