Unpicking the presidential election forecasts
A number of groups publish statistical models, usually updated daily, which attempt to assign probabilities to the possible outcomes of the US presidential election. The best-known is Nate Silver’s fivethirtyeight.com. Others include models from The Economist, Decision Desk HQ, and the New Statesman.
These models all work in a similar way. They start by trying to get a best estimate of the current opinion poll averages, both at national and state level, correcting as best they can for the perceived quality of each polling organisation and any systematic bias it has shown in the past. Then they extrapolate forwards to the actual election date, adding in estimates of uncertainty based on the historic experience of how closely polls this far out from the election have reflected the final result, making adjustments for factors such as incumbency and the state of the economy, and using historic and demographic correlations between states to fill in any gaps in the polling. All this information is then crunched through thousands of computer simulations with small tweaks to the assumptions to come up with state-level predictions which can be aggregated to the final probabilistic forecast.
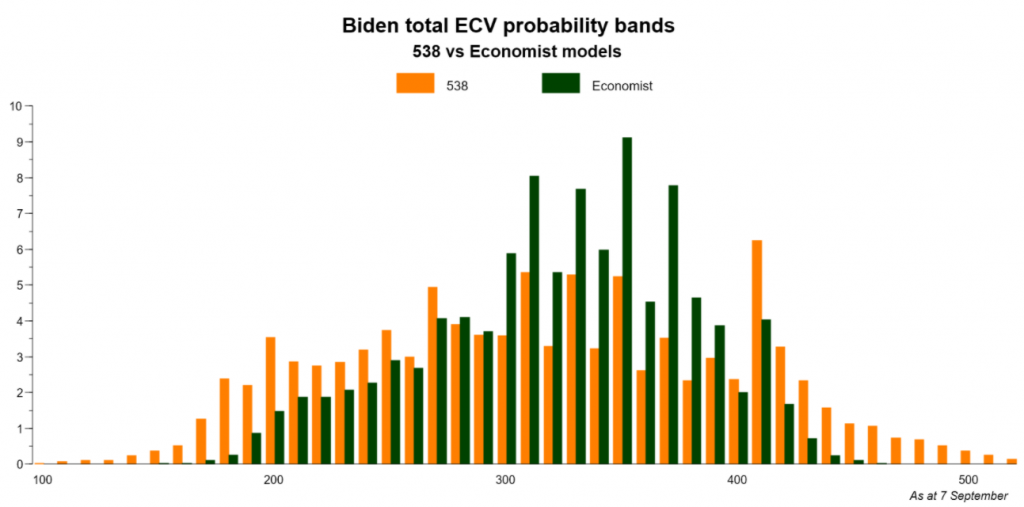
As at the 7th September, these models tell us that the probability of a Biden win is 71% (538), 84% (Economist), 84.2% (DDHQ), or 80.6% (NS). You might raise an eyebrow at the 0.1% precision of the latter two. In addition the models give us probabilities for each state, and headline central forecasts of the total Electoral College Votes (ECV) figures for the two candidates. For Joe Biden these are 322 (538), 334 (Economist), 311 (DDHQ), and 327 (NS), although it’s important to note that these are simply the probability-weighted averages of the scenarios output of each model, not necessarily the most likely or even a plausible specific outcome. More usefully, the models produce probabilities for each possible ECV total, which in the case of 538 and the Economist are displayed as bar-charts and can also be downloaded for analysis. The sum of the probabilities for all ECV totals where Joe Biden gets more than the magic 270 electoral-college majority gives his overall probability of winning.
What do these probabilities mean? A philosopher might ask whether a probability for a one-off unrepeatable event means anything at all, since it is inherently impossible to falsify. Since I’m not a philosopher but an investor in the political betting markets, I’ll focus on the differences between the predictions of these models, and what they might tell us about the betting opportunities, using the 538 and Economist models since these publish the most detailed information and represent the two extremes: 16% chance of a Trump win (Economist), or 28% (538).
First we should note that there is very little difference in their views of the current polling. 538’s current adjusted national polling average is Biden 50.5%, Trump 43.0%. Converted to a two-party equivalent that is 54.0% and 46.0%, very close to the Economist’s 54.3% and 45.7%. Nor is there much difference in their central forecasts of the two-party national vote share on election day: 53.3% and 46.7% (538), against 53.7% and 46.3% (Economist). So how come 538 thinks Trump’s chances are so much higher than the Economist model suggests?
The answer lies in the degree of uncertainty used in the models to jiggle the numbers in each simulation. You can see this most clearly in the bar chart, which shows the probability each model assigns to the possible outcome that Biden’s ECV total will lie within each band of 10 ECVs from 100 to 529. For example the highest bar in the Economist model shows a 9.1% probability of Biden getting between 350 and 359 ECVs, whereas 538 assigns 5.2% to that band.
The point to note here is that the two models are broadly consistent in where they say the most likely outcomes lie, but they vary a lot in the shape of the tails of the distribution. Look at the 538 probabilities for the bands under 200 or over 450 Biden ECVs. The spread of non-negligible outcomes is much wider for 538. Specifically, 538 gives Biden a 7.2% chance of winning fewer than 200 ECVS, and 8.9% of more than 430. For the Economist, the corresponding numbers are 1.1% in each case.
I don’t know what a philosopher would say, but as a betting man I wouldn’t back 538’s odds for those extreme bands, which involve Biden losing states down as far as Colorado or Virginia, or winning up to South Carolina or Missouri. And if the 538 model is over-estimating the extremes, flattening the distribution so much, it must be under-estimating the central bands, pulling down Biden’s quoted chances of victory because it takes a large chunk of the probability out of Biden’s central winning zone of 300 to 370 ECVs into Trump-victory territory of Biden getting fewer than 270 (and also some into Biden landslide territory, but that doesn’t alter the headline odds of him winning).
Punters will make their own minds up, but for me the shape of the Economist forecast looks more plausible in an election where opinion is very polarised and (so far) quite stable – even if they don’t seem to know about the Maine and Nebraska congressional districts. That makes the current odds on a Biden victory, or a buy on the spreads, good value.