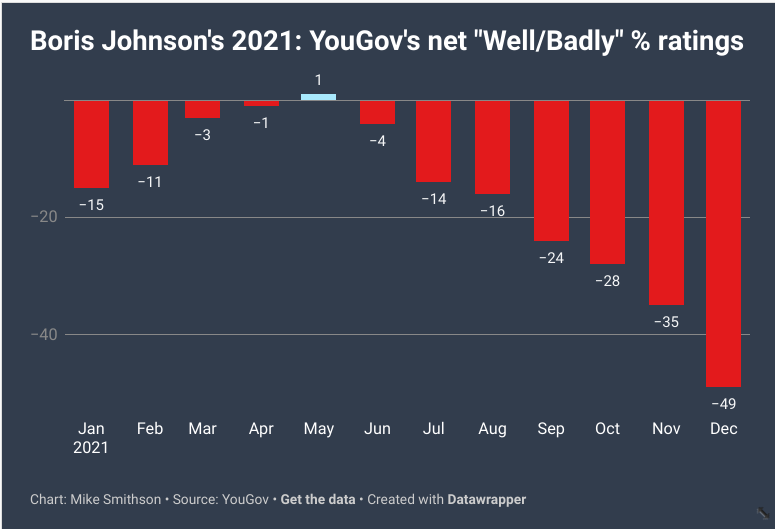
How Johnson did in 2021 according to YouGov’s “Well/Badly” ratings

It is the last day of the year I thought it might be good to have a few posts just looking back at how the data has changed.
My first chart is based on the regular YouGov well badly ratings that are asked at least once a month when respondents are simply asked the question about whether they think the PM is doing well or badly.
As can be seen he started with negative numbers but this crept up to net plus one in May at the height of his “Vaccine Bounce”. This started to wear off as the months went by and he ended the year on a net minus 49%.
A big question for 2022 is which direction will the numbers go next?