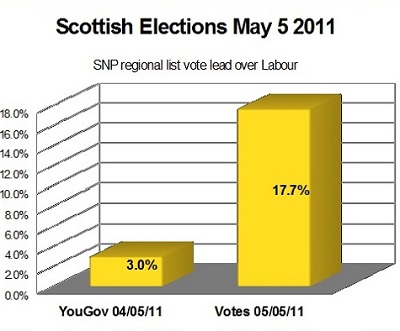
Does this put YouGov’s daily movements into context?

Remember Scotland May 5 2011?
There was as lot of excitement on Tuesday night when the News International/YouGov daily poll came out showing the Tories on 39% – just one point behind Labour on 40% – the smallest Labour lead for months.
Last night’s poll had it looking differently although the changes, Labour up 2 the Tories down 2, were within the margin of error.
But how much notice should we take of the daily changes from the online pollster with its controversial newspaper weightings?
The chart above looks at the last time the firm’s political party shares were tested against real results – in this case for the regional vote in the Scottish parliament elections on May 5 2011.
YouGov’s final poll on May 4 had the SNP on 35% with Labour not far behind on 32%. When the votes were counted the SNP finished up with 44.04% on the regional list with Labour down at 26.31%.
On the same day, of course, there was the national referendum on AV when the pollster’s final survey was 15.8% short of the actual winning NO margin. ICM, by contrast got it almost spot on. Alas there was no ICM survey during the final six weeks of the 2011 Scottish campaign. Four years earlier the firm had come out as top pollster.